
Email marketing is the backbone of eCommerce but many still struggle with turning its potential into results.

With a huge pool of unique data at our fingertips, we’ve given the top eCommerce email marketing tactics a run for their money.
In an effort to determine what works, what doesn’t and how to boost your marketing ROI,
we have analyzed more than 964 million emails from 7,200 brands using Omnisend’s eCommerce marketing automation platform.
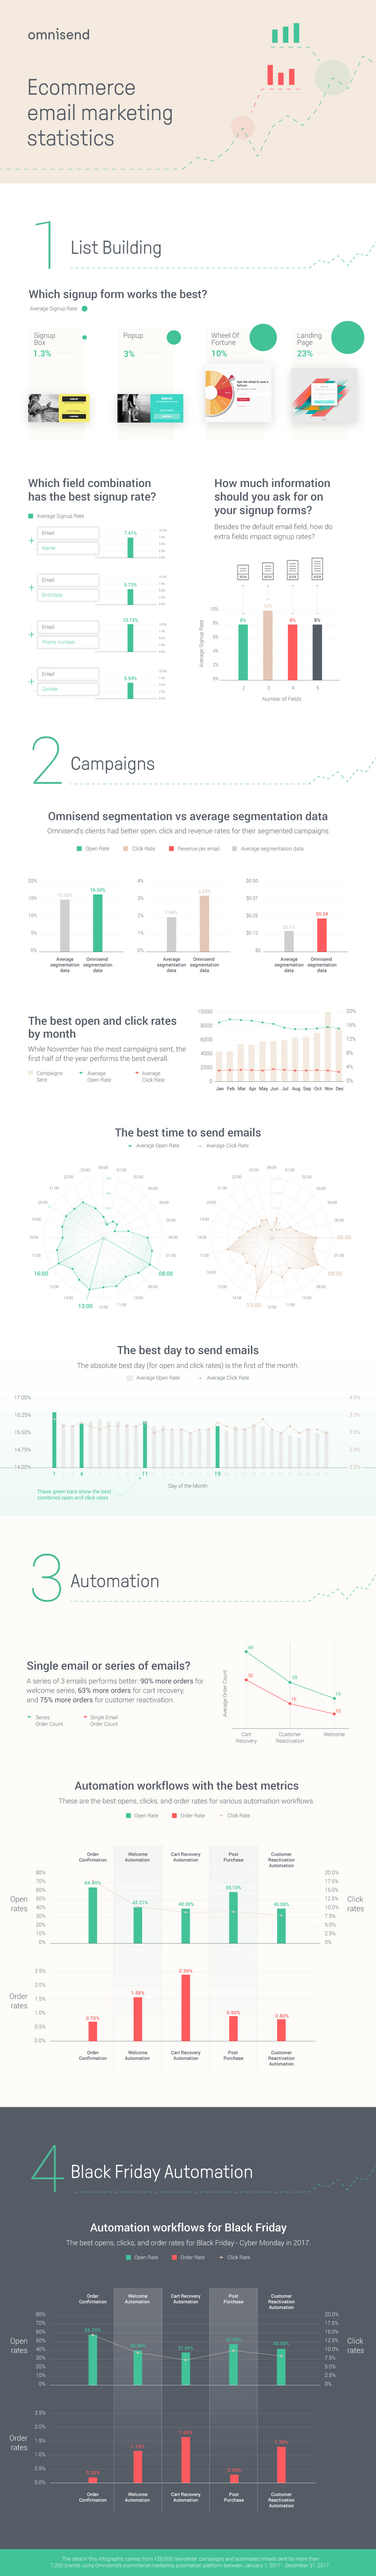
Here’s a neat summary of Omnisend’s eCommerce email marketing statistics for 2018.
E-commerce email marketing statistics: 7 major takeaways
- Cart abandonment emails still achieve the best results during Black Friday (1.65% order rate), however, compared to the rest of the year, that’s a 31% decline.
- Compared to the rest of the year, during Black Friday, customer reactivation (or customer win-back) orders have increased by 106%.
- To improve your link-building efforts, it’s advisable to use a wider range of sign-up forms. For instance, landing pages (23%) and the Wheel of Fortune (10%) demonstrate the best conversion rates.
- It’s okay to ask customers for more information. In fact, you could achieve 10% higher conversion rates by asking for up to 3 pieces of information on your sign-up forms.
- Unsurprisingly, November has the highest number of campaigns sent (thanks to Black Friday), however, February offers the best open rates (17.9%) and June the best click rates (3.6%).
- In terms of automation, the order confirmation email has the best open rates (64.4%), while cart recovery emails achieve the best order rates (3.6%).
- In general, automation workflows massively outperform bulk newsletter campaigns, achieving 309% higher opens and 455% better click rates.
Manual email campaigns vs. automated emails
Manual email campaigns hardly stand a chance against automated workflows. A manual newsletter without segmentation averages an open rate of 15.73%., while the overall general average open rate is 3.26%. Automated workflows, on the other hand, achieve results that put manual campaigns to shame.
- Welcome series: with a 42.2% open rate and 10.5% click rate, automated welcome series achieve 168% more opens and 222% higher click rates than manual campaigns.
- Order confirmation emails: delivering a 64.4% open rate and an 18.1% click rate, order confirmation emails have 309% more opens and 455% higher click rates than manual email campaigns.
- Order follow-ups: a 59.1% open rate and 9.1% click rate, order follow-ups generate 275% more opens and 179% higher click rates than manual email campaigns.
- Cart recovery emails: with a 40.% open rate and 9% click rate, cart recover emails have 154% more opens and 176% higher click rates.
- Customer reactivation emails: this series of automated emails boasts a 40.8% open rate and 7.8% click rate, achieving 159% more opens and 139% higher click rates than manual email campaigns.
How do Black Friday statistics compare to the rest of the year?
We have looked at the automated email data from the Black Friday 2017 sales period and picked up on a few stand-out statistics:
- The open rates in November were among the lowest of the year, but the click rate was pretty good
- Brands send 3x more cart abandonment emails than customer reactivation emails
- But reactivation emails generated 106% more orders for brands compared to the rest of the year, with a 1.3% order rate
- Cart abandonment emails delivered the best order rate for Black Friday (1.65%), however, compared to last year, it’s a 31% drop
The takeaway lesson here is to keep your automated workflows well-diversified to make the most out of this shopping event.
How did Omnisend determine the average segmentation data?
We used data garnered by other marketing tools to establish a benchmark and compare Omnisend client’s segmentation results to the eCommerce average.
In this study, we have leveraged Klaviyo’s Email Segmentation Benchmark Report, which provided us with the following insights (with some approximations based on the graph):
- segmented emails had an open rate range of 14-16.17%
- segmented emails had a click rate of 1-1.99%
- segmented emails had a revenue rate of $0.10-$0.19
Our own data demonstrated that segmented emails achieved the following:
- an open rate range of 16.5%
- a click rate of 3.23%
- an average revenue rate of $0.24
How did Omnisend come by this data?
Omnisend integrates with the leading eCommerce shopping carts, such as Shopify or Bigcommerce. This gives our platform a unique 360-view of our clients’ email marketing campaigns as well as their ROI.
By closely monitoring the performance of various emails, we are able to accurately determine which types of campaigns convert better and when, their exact ROI, the difference in revenue generated by automated workflows vs. manual campaigns, and more.
Omnisend users can access a lot of this data for themselves in their own reports.
What types of companies are included in this research?
This research is based on Omnisend customer data – specifically, 7,200+ active online stores in 130 countries. We have looked at email campaigns that were sent throughout the year, from January 1 to December 31, 2017.
In terms of specific eCommerce niches, a good chunk of the companies in this study sell books, small electronic devices, accessories, and apparel. Additionally, Omnisend enjoys a global client base, with the majority of our clients operating in the UK, the United States, Canada, India, and Australia.
The goal of this infographic was to provide marketers with a high-level overview and some valuable insights around the main metrics.
Have we missed anything? Let us know in the comments!


